Introduction
jmeter -n -t command is mostly used when the script is ready to be executed. Before talking about performance testing in JMeter, i would like to visit this blog, that is about performance and different tools used for performance testing. Jmeter is an open-source performance testing tool that allows you to test the performance and load handling capabilities of web applications, APIs, and various services. It enables you to simulate multiple users and measure an application’s response time and scalability under different levels of load. JMeter is a tool for performance testing, stress testing, and load testing of software systems.
JMeter is not a browser, It doesn’t support JavaScript and AJAX requests.
Installation
Installation is pretty simple, go step by step.
- Installation is simple, install the required version of the java and set JAVA_HOME environment variable.
- Download and extract it to your desired location.
- JMeter support two mode
- GUI mode, jmeter.bat
- CMD mode, jmeter -n -t testfile.jmx, other supported parameters are:

Plugins
To install a plugin, you need to download the jar files of the plugin manager from the JMeter site, move it to the lib/ext folder, restart JMeter and you can see the plugin manager under options.
Some useful plugins are,
- Custom Thread Group
- 3 Basic Graphs
- Throughput Shaping Timer
- Dummy Sampler
Configuring a test plan
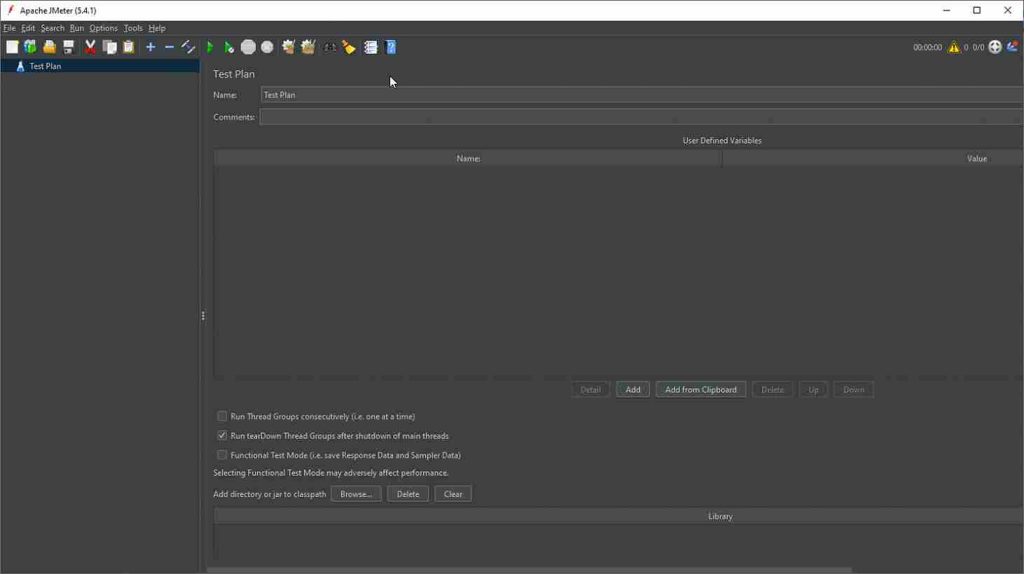
The root element of a test, where it has overall settings, and all the other elements.
User- Defined Variables
User-defined Variables are nothing, but name-value pairs used to store configuration data of the test.
Run Thread Groups Consecutively (i.e., one at a time)
A Test Plan can have one or more Thread Groups. It should have at least one Thread Group (which is the minimum requirement) but can have more than one too. If a Test Plan has more than one thread group, then it will execute one after the other if you check this checkbox. If this checkbox remains unchecked, then all the thread groups will execute in parallel.
Run teardown Thread Groups after the shutdown of the main threads
The Teardown feature is generally for reporting or cleaning operations. For example, if you want your logs to clean automatically after the execution of a Test Plan or want your reports to format then you may use this property of the Test Plan.
Functional Test Mode (i.e., save Response Data and Sampler Data)
If this you select this checkbox, then listeners save sampler requests and response data.
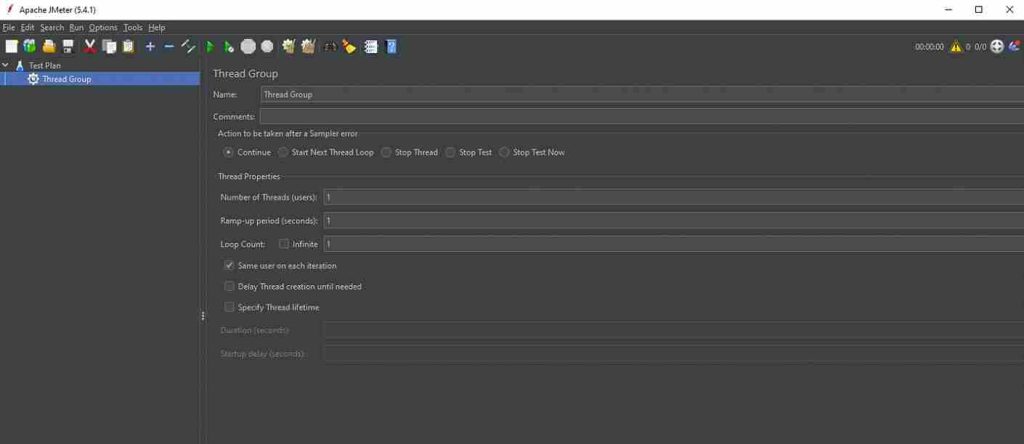
Thread Group
Controls the number of threads(users) JMeter will use to execute your test. A test plan has more than one thread group each representing a test case. It’s a child of a test plan, use setup and tear down thread groups if required.
Ramp-Up period is the time JMeter will take to create users.
By default, a thread group will execut once against an element, but you can iterate it.
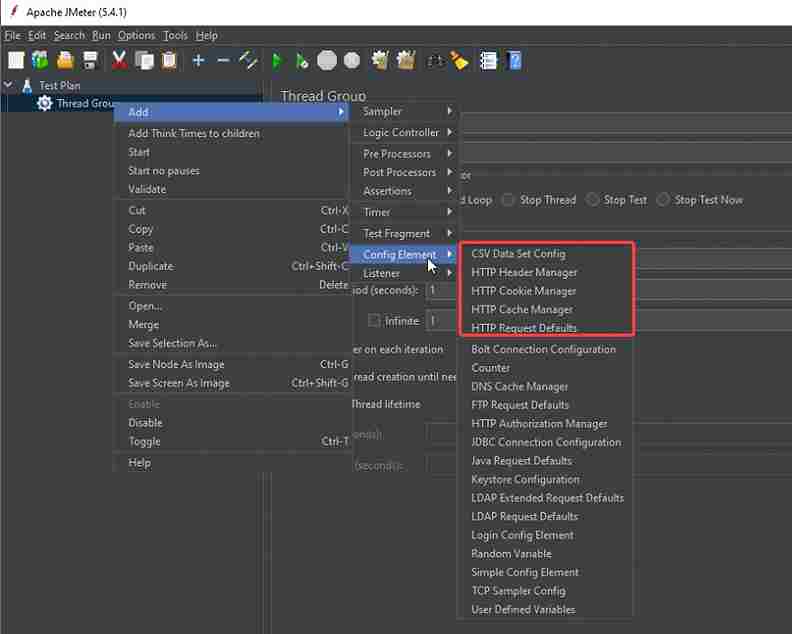
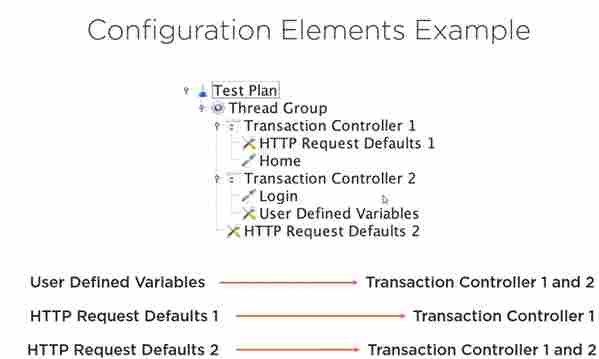
Configuration Elements
Used to set up default configurations and variables for later use.
- CSV Data Set Config element for to read data from a text or CSV format file.
- HTTP Request Defaults Configuration Element let us set default values to be used in HTTP Request Samplers.
- HTTP Cookie Manager for storing cookies that the targeted server sends in response to your HTTP request. The saved cookies are for other samplers/requests of the Test Plan.
- HTTP cache manager
- HTTP cookie manager
- HTTP header manager
- HTTP Authorization manager
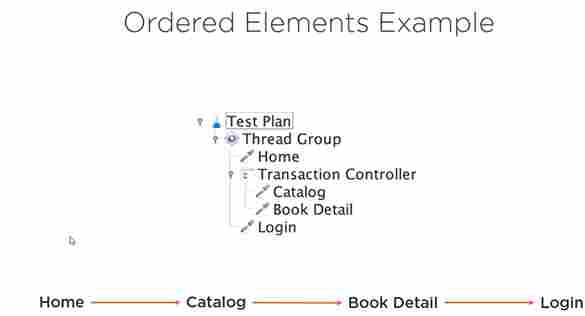
Two types of controllers are Sampler and logic controllers
Samplers are the components that allow JMeter to send specific types of requests to a server. It simulates a user’s request for a page to the target server. Samplers are a must to add the component to a test plan as only it can let JMeter know what type of request needs to go to a server. Requests could be HTTP, HTTP(s), FTP, TCP, SMTP, SOAP, etc.
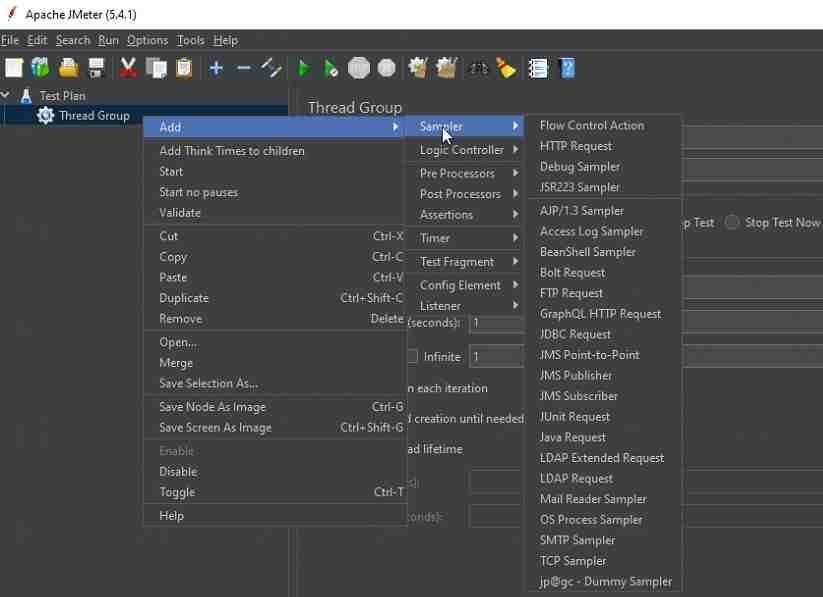
Logical controllers let you customize the logic to decide when to send requests. e.g., when a condition becomes true.
- Simple controller – is nothing just grouping of the requests.
- Transaction controller – to get a matric of collective request.

Timer
Introduces delay (pause) between requests to avoid unrealistic load. They can be added anywhere but are usually added as children of the sampler or controller to which they apply.

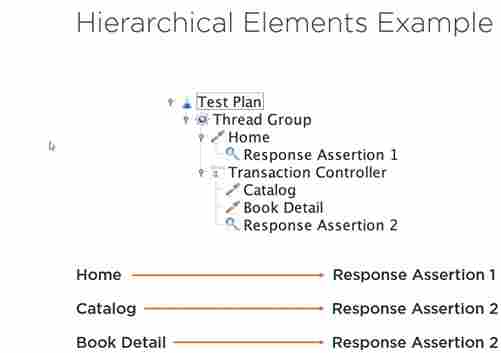
Assertion
Validate the response as expected. The most common assertions are
- Response code
- Size assertion
- Duration assertion

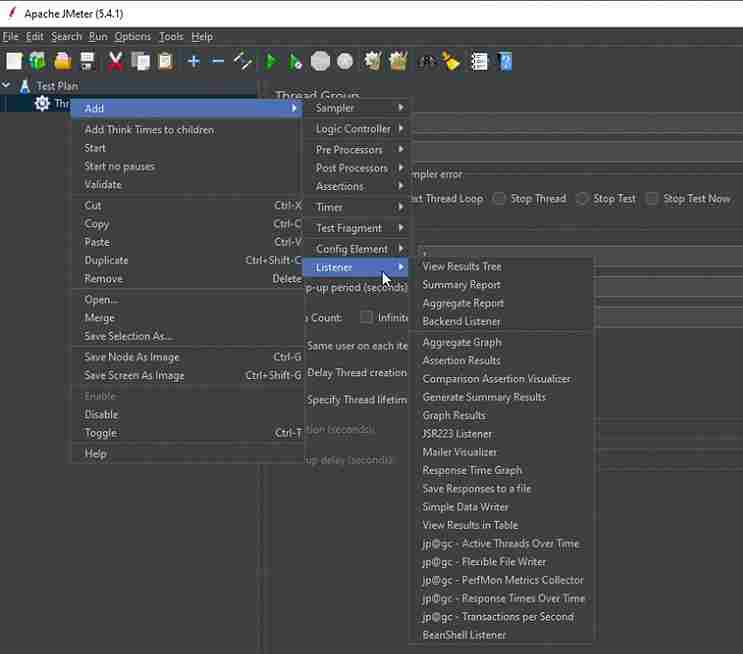
Listener
Listen to responses and aggregate metrics. Common listeners are.
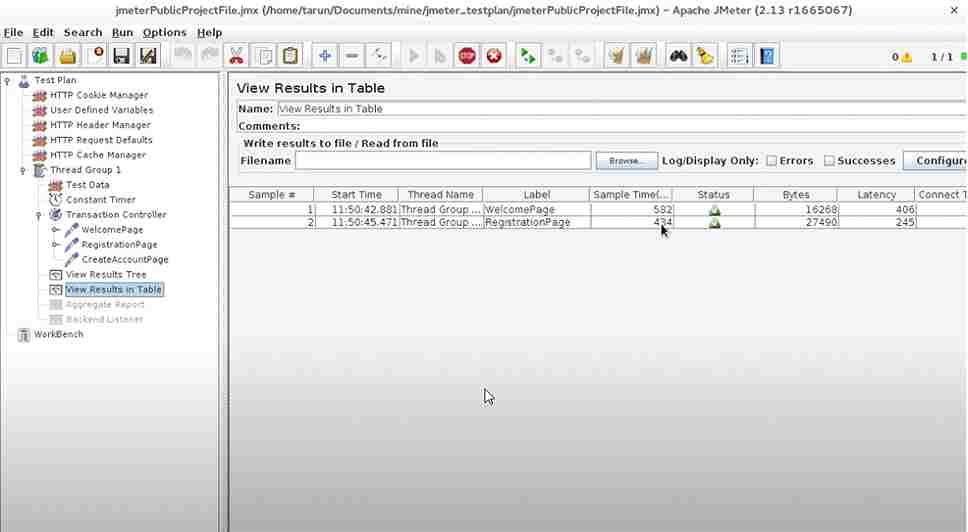
- View results in the tree (Do not use it all the time, its memory consumption is high)
- Aggregate report
- Graph results
- Summary report
- Simple data writer
- Assertion results if you are using an assertion element other than the default.
All listeners save the same data, the only difference is the way the data is presented Listeners can use a lot of memory.
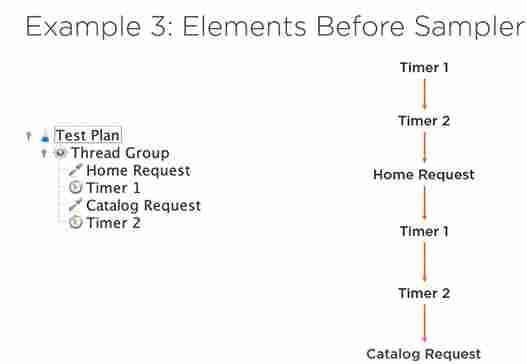
Order of Execution
Please note that Timers, Assertions, and Pre- and Post-Processors are only processed if there is a sampler to which they apply. Logic Controllers and Samplers are processed in the order in which they appear in the tree. Other test elements are processed according to the scope in which they are found, and the type of test element.
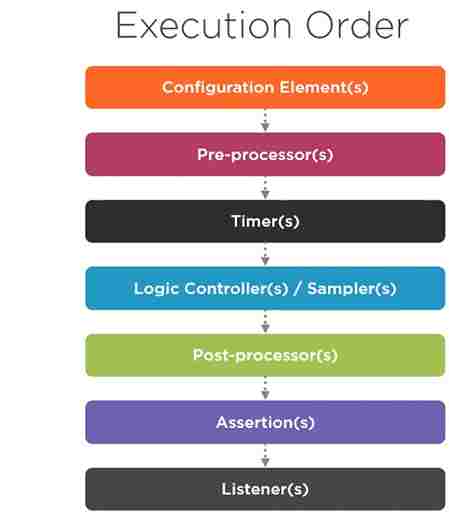
To remember the execution order, use the acronym CONF-PTS-PAL
Thread groups are executed in the sequence of
- Setup Thread Groups
- Thread Groups
- Teardown Thread Groups
User-defined variables configuration element is processed at the start of a test, no matter where it is placed.
Configuration element inside a tree branch has higher precedence than another element of the same type in an outer branch.
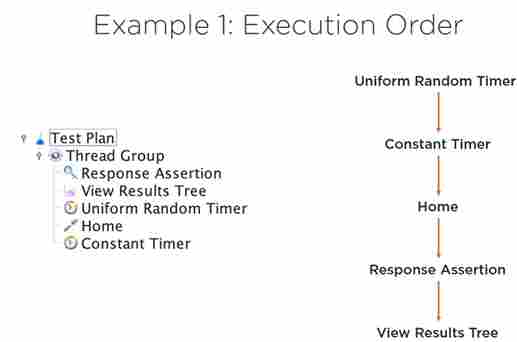
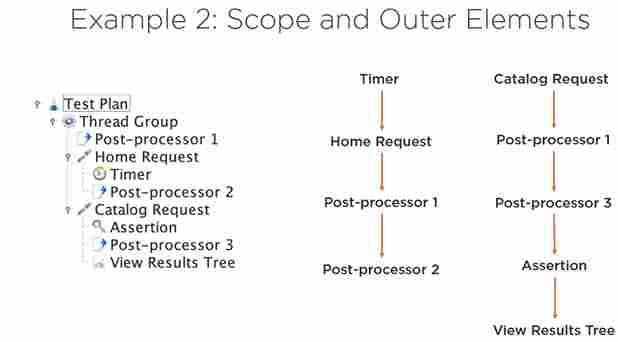
Outer elements are executed before inner elements of the same type
Recording a test
See detail here, https://jmeter.apache.org/usermanual/jmeter_proxy_step_by_step.html
Steps are
- Go to JMETER_HOME/bin and start JMeter with jmeterw.bat on Windows and jmeter. sh on Linux/Unix
- Select Templates… on the menu bar
- Select the Recording template on the list
- A complete Test Plan is generated
- Return to HTTP(S) Test Script Recorder and click the Start button at the top.
- Configure your browser to use the JMeter Proxy
- Validate the script
- Variable and correlate the script

Test Script Execution
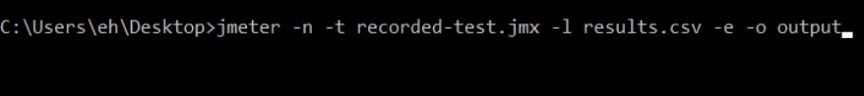
Jmeter application is used to design and develop our test, once we develop the script and it is ready for execution then we remove listeners from our script and run it from the command line using
jmeter -n -t [jmx file] -l [results file] -e -o [Path to output folder]
Collecting and analyzing test results
Performance can be measured in many ways, usually, it is measured using below three matrices.
- Response time
- Throughput
- Error rate
After building and validating a test script, viewing, and analyzing are the next steps. In GUI mode we can view the results using listeners. Which is useful when building a test. However listeners are not recommended to use it because of its high use of memory consumption, use it only for developing, debugging, and validating the tests. The aggregate report helps you to find the response time.
Server-Side metrics
Use the log/Display only checkbox to avoid gathering a lot of data. But it is also important to measure the performance on the server side and resource utilization.
- CPU
- Memory
- Network
- Server Check
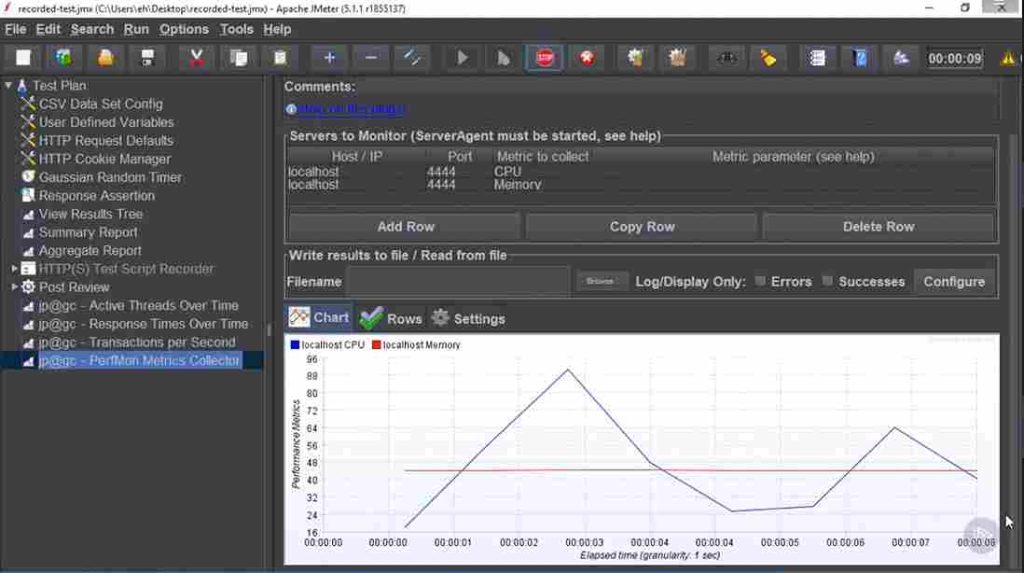
PerfMon is a plugin used to measure the performance metrics on the server side. Along with it, PerfMon Server Agent is also needed to be installed. check https://jmeter-plugins.org/wiki/PerfMon/
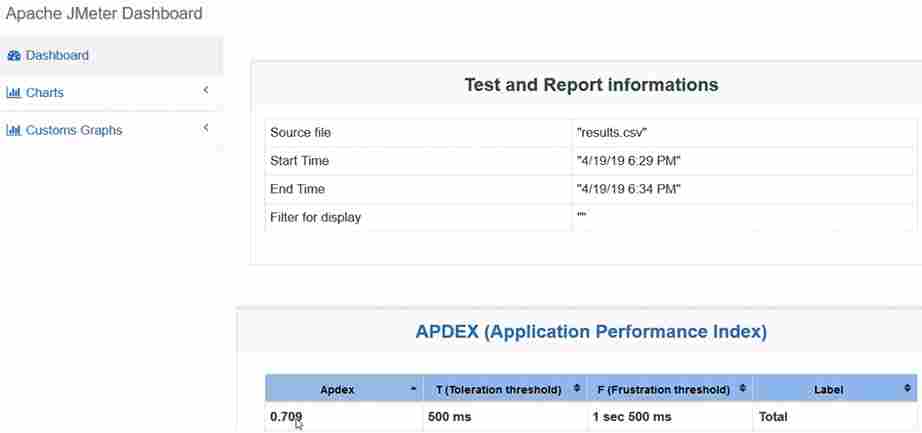
JMeter Report dashboard | jmeter -n -t
CLI is the recommended way of running the test and generating the report, perform the required actions before running the CLI commands and then execute the following
HTML report will be generated, apex is the metric to measure the performance. See the snap below.
Summary | jmeter -n -t
This blog offers a concise yet informative exploration of performance testing using JMeter. It highlights the significance of performance testing in ensuring the robustness of applications and delves into the fundamentals of JMeter, a powerful open-source tool. The blog guides readers through the process of creating effective performance test plans, setting up test scenarios, and analyzing the results. It also touches upon advanced topics like parameterization and distributed testing. Whether you’re new to performance testing or seeking to enhance your JMeter skills, this blog provides valuable insights and practical tips for successful performance testing endeavors.